In this Internet driven information age, Google Analytics is a powerful tool for monitoring, analysing and reporting how users find and then use a website.
Given websites are now an integral component of many extension programs. Google Analytics is a very important tool, as it can be used to show:
- Where website visitors are from
- The characteristics of website users
- How they found the site
- What internet devices they used
- When they visit
- What they do when they visit
- What pages they view
- What time they spend on the site and where they spend it
This information helps extension practitioners assess whether they are reaching their target audience and evaluate, plan and continuously improve their extension websites, to ensure they are reaching their extension goals.
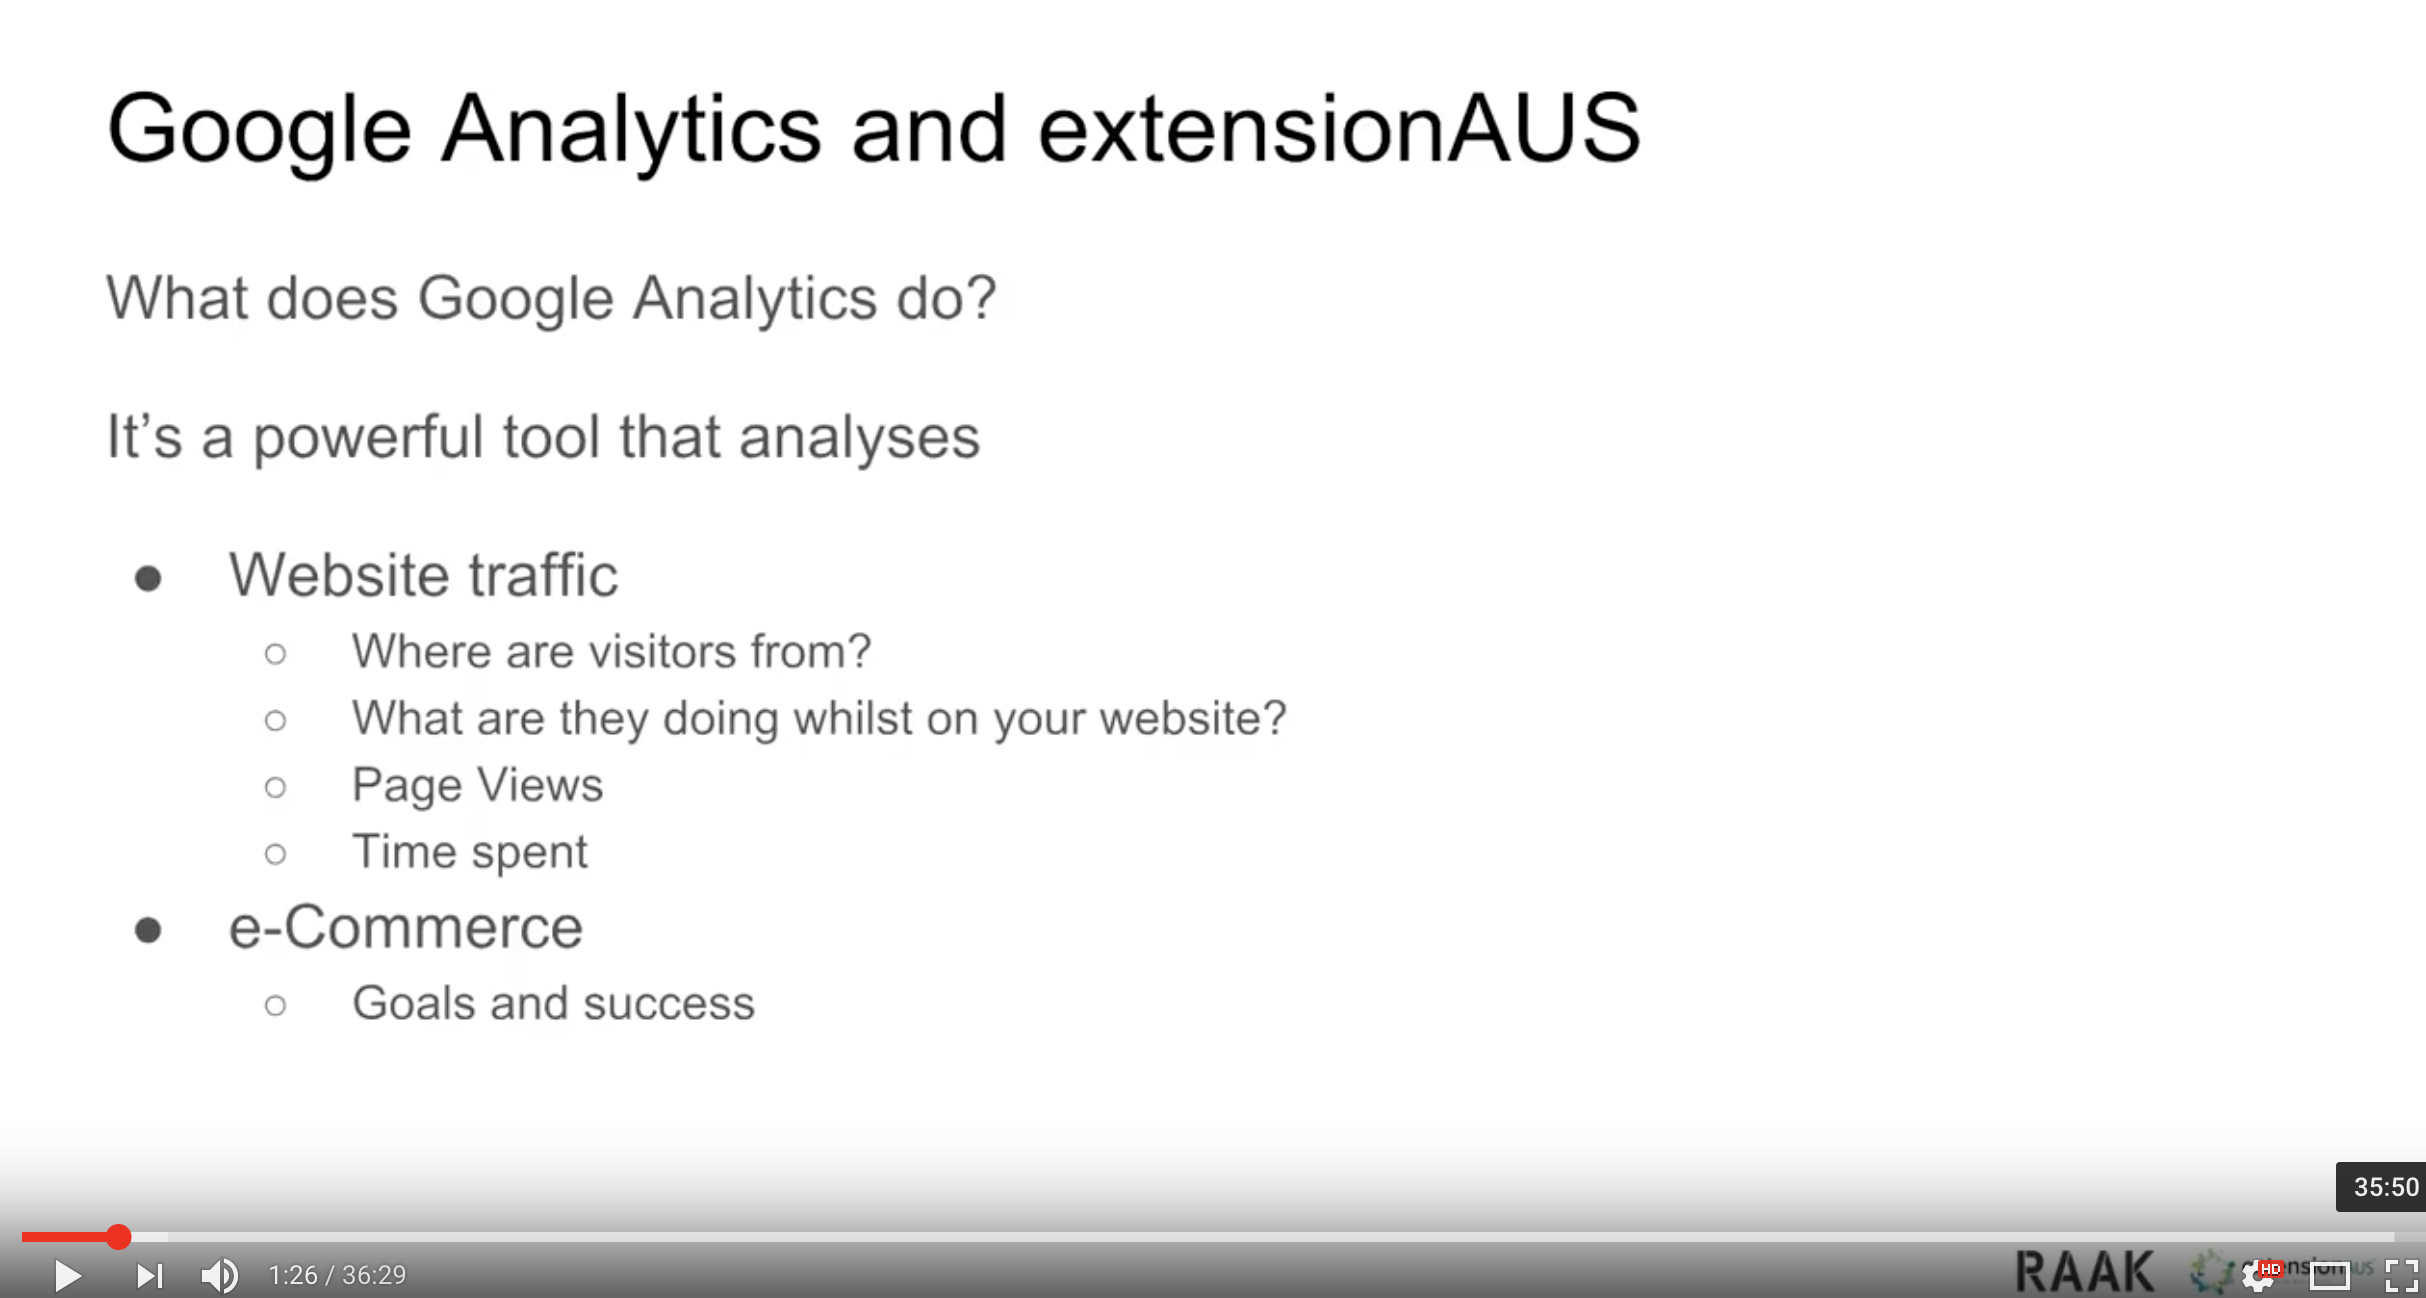
The extensionAUS program (www.extensionAUS.com.au) recently ran a webinar explaining to extensionAUS practioners, how Google Analytics can be used to monitor, analyse and evaluate the websites that they use for extension.
“Getting the most out of Google Analytics Webinar”
Why is it important?
Website evaluating and then using the information to better maintain and update them, is now absolutely critical; particularly if the website is a key component of an extension program, for the following key reasons:
Discoverability
Regularly updating your website content, along with a good system for search engine optimisation, will keep your site higher up in the rankings of search engines and therefore much easier to find.
Credibility
Regularly updating the content, shows your target audience the site is active, timely and relevant. In this day and age, this is important for proving the credibility and importance of the site to users. Users will quickly click away if your site is not active and if it is clear that it is not being maintained and is not current.
Relevance
As so much information is available online, your target market is looking for a point of difference in how your site can meet their information needs. This point of difference is the value proposition of the website and it will include the site being relevant, trustworthy, timely and interesting. Regularly updating to ensure your content has these characteristics, is critical to growing and retaining your audience.
How Google Analytics works
Google Analytics is provided as a free account by Google. An account has four levels of access:
– Manage Users
– Edit
– Collaborate
– Read and Analyse
Further information on the levels of access can be see here:
“Manage the list of users who have access to your Google Analytics account”
It is absolutely critical that Google Analytics is properly configured for the website in question.
User
In Google Analytics, a visitor to a website is referred to as a “User” and they are identified by their Internet Protocol (IP) address. An IP address is the identifying number for an internet device that allows them to communicate on the internet. Like physical addresses, an IP address will show the location of the device.
When a User visits a website, Google Analytics then monitors them, using the IP address of the device they are on. It is a unique measurement, in that when they return to a website, they are then identified as a return User.
Session
Each time a User engages with a website, is called a “Session”. A Session is when a User is active on a website. If a User is on a site, but is inactive for 30 minutes; whenever they are active after that, will count as a new session. Google Analytics measures the duration of each Session.
Pageviews
Google Analytics monitors Pageviews and Pageviews per session. A Pageview is when a page on a website is viewed within a session. Pageviews/Session, is the average number of pages per session on the website for a given period of time, i.e. per day, week, month, year or for a designated time period.
Bounce Rate
Bounce rate is another key Google Analytics metric. It gives the percentage of one page viewed sessions, i.e. when a User leaves a website after viewing only one page in a session.
Breaking down the data in your Google Analytics account
View
A view Is a subset of a property (website) with its own settings. For example, you might want to setup one view for NSW and another for VIC visitors, or a view for reports that can only be seen by certain people. See: “How to add a new view”
Filter
This allows you to limit the data that is to be included in a view. For instance, you can filter out visits from your own IP address or from certain domains, so that it does not skew the results. See: “Create and manage new filters”
Segment
This is a subset of Analytics data. For example, of your entire set of users, one segment might be users from a particular country or city. Another segment might be users who visit a particular part of your website. See: “About segments”
Using Google Analytics
A Google Analytics Account is your point of access to Google Analytics. When you open your account, it will open in the Admin section and show the Properties and Apps you are monitoring and the Views.
A property is a website that you are set to collect data from, a Google Analytics Account can be used to monitor multiple properties. A property can also be a particular application or device that is used to access websites. See: “About Properties”
A view is how you access your reports. A report is based on the data that has been set up to be viewed in relation to a property (website). They can be customised. See: “Create and manage Custom Reports”
A filter is the way data in a view can be segmented into smaller subsets called segments. This allows you to drill down into your data and provide specific reports to meet your information needs.
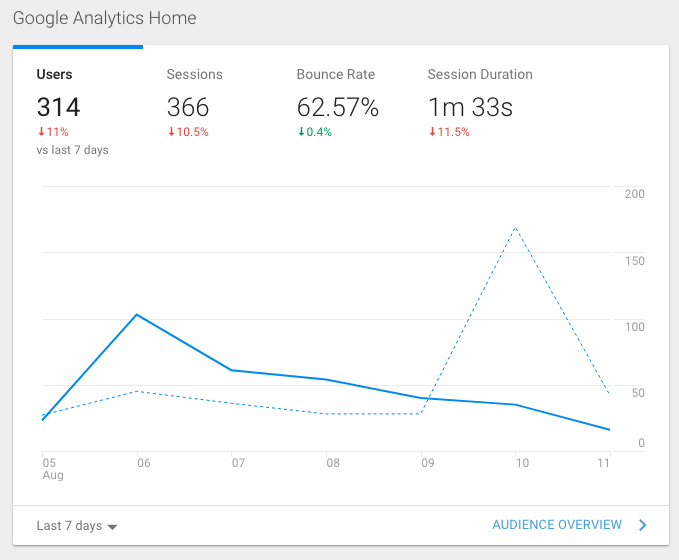
The default view is “All Web Site Data”. When you click on that, it will show the last seven days of website traffic. The number of users, sessions, the bounce rate and session duration for those seven days. The time range can be changed by clicking on the drop-down box in the left-hand corner of the display box.
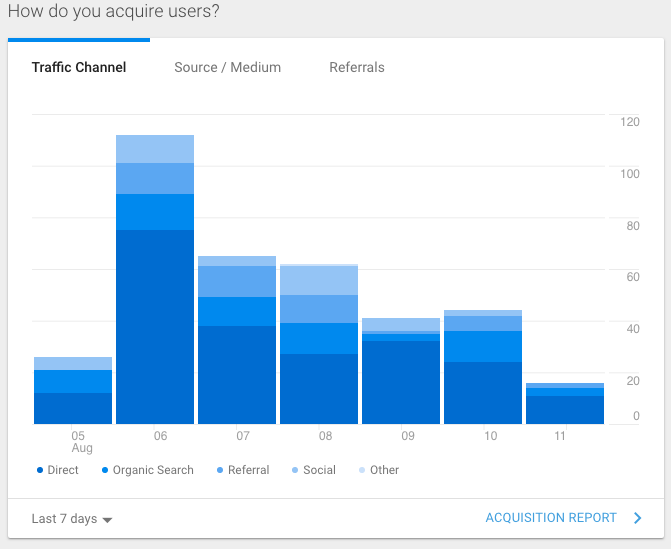
Information on how users are acquired by the website is given via a bar graph which shows:
- Organic Search – Via searching in a search engine
- Direct – By users typing in a URL to reach the website. Note that clicking on a link from an email, offline documents (word, pdf, etc) and from mobile social apps, will also be categorised as “Direct”
- Referral – By clicking a link from another website
- Social – From clicking a link on a social media site
Where users are from is shown by country, the time of day they visit is also shown, as is the device they are using to view the website. Each of these areas can be drilled into further by clicking on the link to their drop-down boxes.
Creating a view
Go to the admin section, click on creating a view and ensure you are in the right time zone. See: “Add a new view”
Give the view a name and to set it up, edit the settings of the view. See “Edit view settings”
Identifying incorrect analytic results
These can be found by noticing unusual spikes in any of the statistics. Analyse the Users origin or Acquisition origin data, to see where the traffic is coming from. Then you can create filters to exclude traffic that is skewing the results.
Bots, spiders/crawlers
These are programs that harvest information for search engines. When they visit a website, they are identified as a User. In the “edit view settings” of Google Analytics you can select “Bot filtering” which then excludes sessions from known bots and spiders from your results. See: “Edit view settings”
Note that when people visit your site using different devices. E.g. they visit on a desk top computer and then visit again on a mobile phone, they will be counted as an individual User each time. When they are really the same User, but on different devices.
Best metrics to use for extension focussed websites
Active Users, Bounce Rate, Page Views and Average time spent on a page are all good indicators as to whether your site is being used effectively. For instance, a high bounce rate with a low session duration, may indicate that people are arriving at your site, but not engaging fully and really reading the information on offer.
For blog type websites, a bounce rate of 40 – 60% is seen as reasonable, but obviously if pages have low time spent on them, this is an indication that users are not engaging with and using the content.
Users Flow will show the pages that are being landed upon and where using go to from there on the website. See: “Analyse your date with User flow”
Acquisition will show how Users are reaching the website and Mobile Overview will show you the devices that are being used.
Conclusion
Understanding the stories behind the figures is the name of the game
For instance, if you are directing people to particular pages using a social media campaign, then a high bounce rate may well be acceptable. If it is associated with the pages that the campaign is about and the page is being viewed for a long enough period of time that you can infer it is being read.
Creating Custom Dashboards (see create and customise dashboards) and Reports using Custom Alerts (see create and manage custom alerts) and setting Goals (see create, edit and share goals) are all good ways of personalising Google Analytics to get the information that you need.
Using Filters to ensure your Reports are reporting what you need is important.
By setting Goals and then measuring Conversions against the goals, gives greater insight on whether the extension goals for a website are being met.
Data is only good if you use it. Set up key times that your Google Analytics reports are to be reviewed and by whom and set up a planning process for the continuous improvement of the website.
Information sources and for further information
extensionAUS – Getting the most out of Google Analytics Webinar
Google Analytics Help Centre – For tips and tutorials on using Google Analytics and answers to questions